

Initial jobless claims up, while Wall Street continues gains
Initial jobless benefit claims rose by 13,000 to 215,000 in the week ended Feb signalling that all is not well in the US labour market. The number of Americans receiving jobless benefits is now totalling 1.91 million people.
Pending home sales also fell significantly through February, falling 4.9% giving it the biggest fall in over 5 months. Economists were expecting pending home sales to actually increase for the month, which is cause for alarm as home purchasers steadily begin retreating from making aggressive buy decisions in the current high interest climate.
And looking ahead, applications for mortgages is also trending downwards as mortgage rates continue to hover above 7% per annum.
Next week we can look closer at data for Job openings and the unemployment rate for February. This will help frame a better picture of the US economy.
And while the housing market is beginning to cool, the sharemarkets continue to prompt new highs. The SP500 is building new strength around the 5000 mark, and ASX200 is now confidently pushing upwards through its 7700 mark. With everything looking rosy in the sharemarkets, we’re also looking across at the crypto market and seeing Bitcoin yet again find new strength, pushing through $AU100,000. While many look to crypto’s strength as a sign of market wellbeing, we’re more likely to look at an overheated crypto market and take pause, as when one bubble starts to form generally we see indicators that other bubbles are ready to pop.
And all this growth during a monetary tightening period continues to astound. With everyone piling into equities and property with the hope that when the FED begins easing monetary policy, prices will increase even more. What we’ve learnt from previous cycles, is that it is never that easy. Something will need to break.
Enjoy today’s charts and forecast.
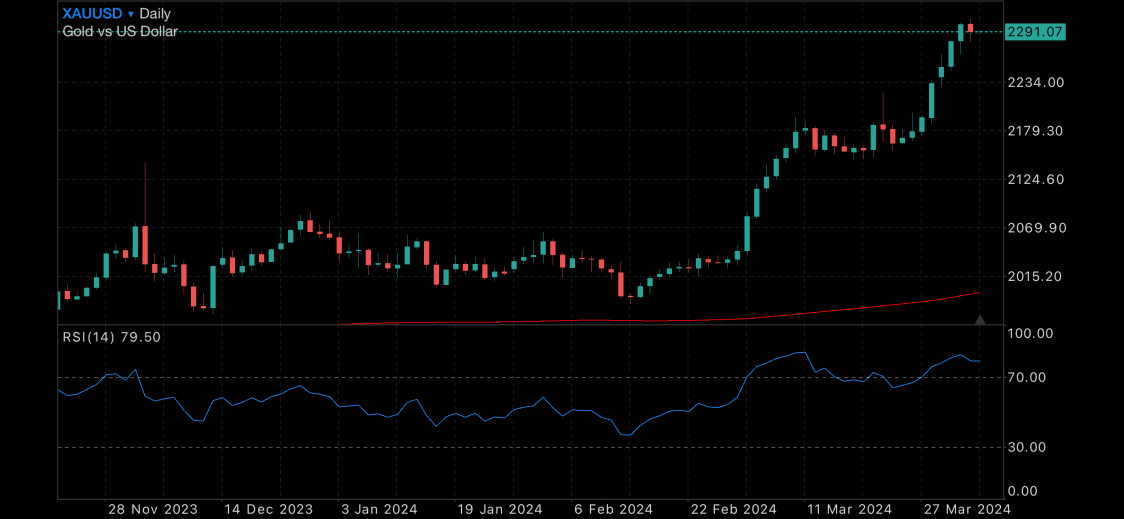
Gold daily chart, with 200MDA
Silver daily chart, with 200MDA

ASX200, with 200MDA

US500, with 200MDA

Gold Futures Technical Analysis
Gold Futures monthly analysis continues to recommend a STRONG BUY with Weekly analysis a STRONG BUY signal.
Technical indicators - Monthly Projections
RSI(14) | Buy |
STOCH(9,6) | Buy |
STOCHRSI(14) | Overbought |
MACD(12,26) | Buy |
ADX(14) | Buy |
Williams %R | Buy |
CCI(14) | Buy |
ATR(14) | Less Volatility |
Highs/Lows(14) | Buy |
Ultimate Oscillator | Buy |
ROC | Buy |
Bull/Bear Power(13) | Buy |
Summary for Monthly forecast: Strong Buy
*Not financial advice, please do your own research prior to any investment decisions you make.